Contents:
Navigate to the Analytics Page
To Navigate to your Try with Mirra Analytics Dashboard in Shopify Admin:
- In the Search Bar at the top of the screen, select Apps and then select Try with Mirra - the app will then appear on the left of screen.
- Underneath Try with Mirra, select Analytics.
- Adjust the Date Range at the top-left of the page if you want to target your data to a specific period of time.
- 90 days is usually a good indicator of current performance.
Order Analytics
The top section of the Analytics Dashboard displays data related to your Try with Mirra orders, often in comparison to regular 'buy' orders.
Note: Data displayed is from a test store, and is not real customer data.
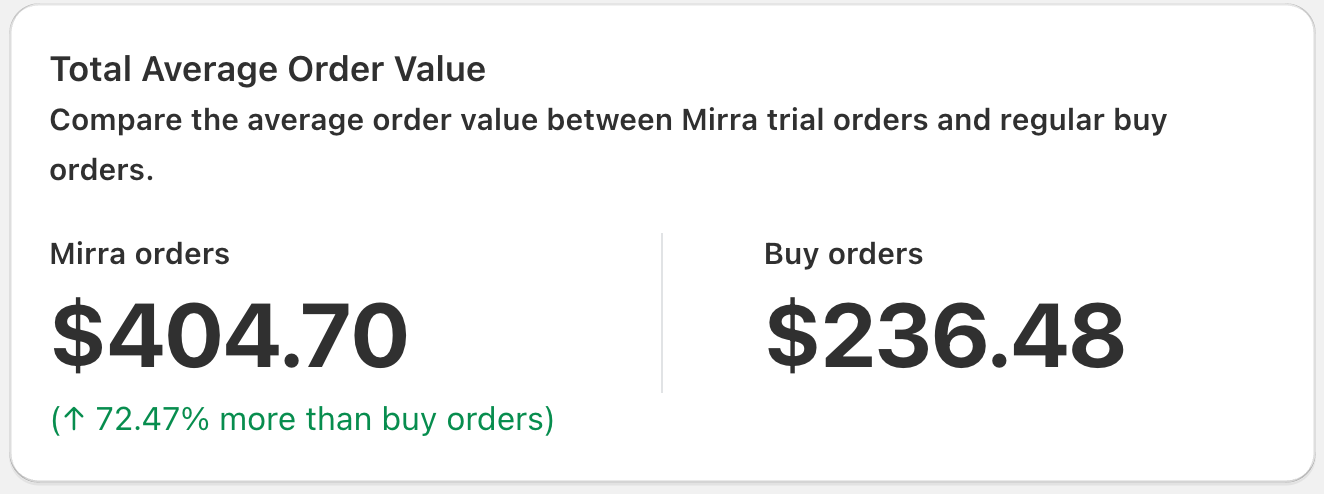
- Total Average Order Value: This widget displays the difference in AOV for completed Mirra orders vs. regular 'buy' orders during the selected time period.

- Note: This number reflects completed Mirra orders only, which are orders where the customer has completed their trial, and is only based off the items they've kept.
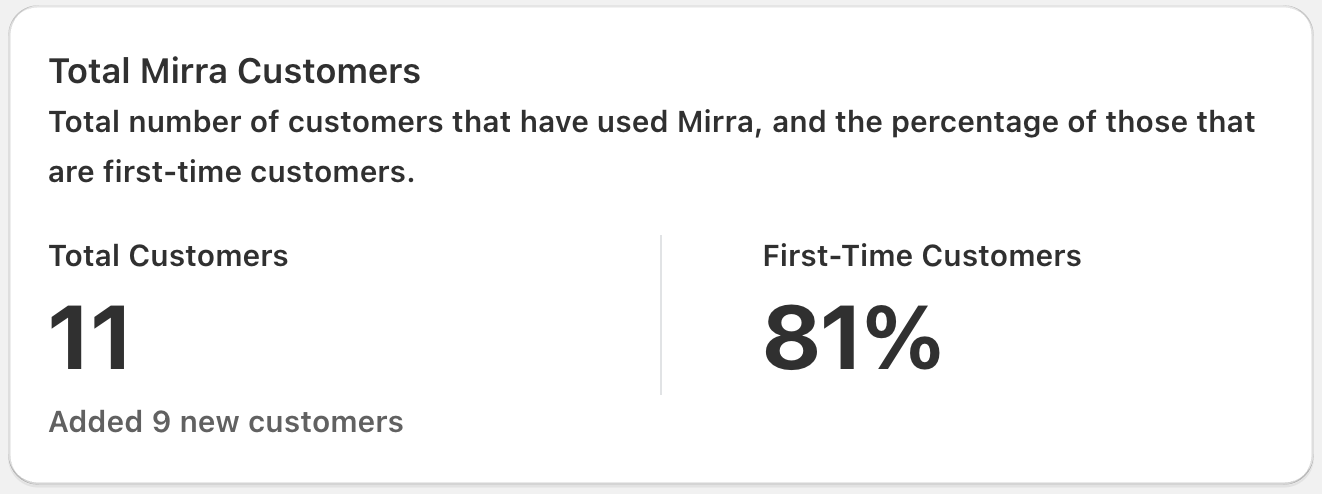
- Total Mirra Customers: This widget displays how many customers have placed orders with Mirra and the percentage of those customers who were first-time customers to your store during the selected time period.

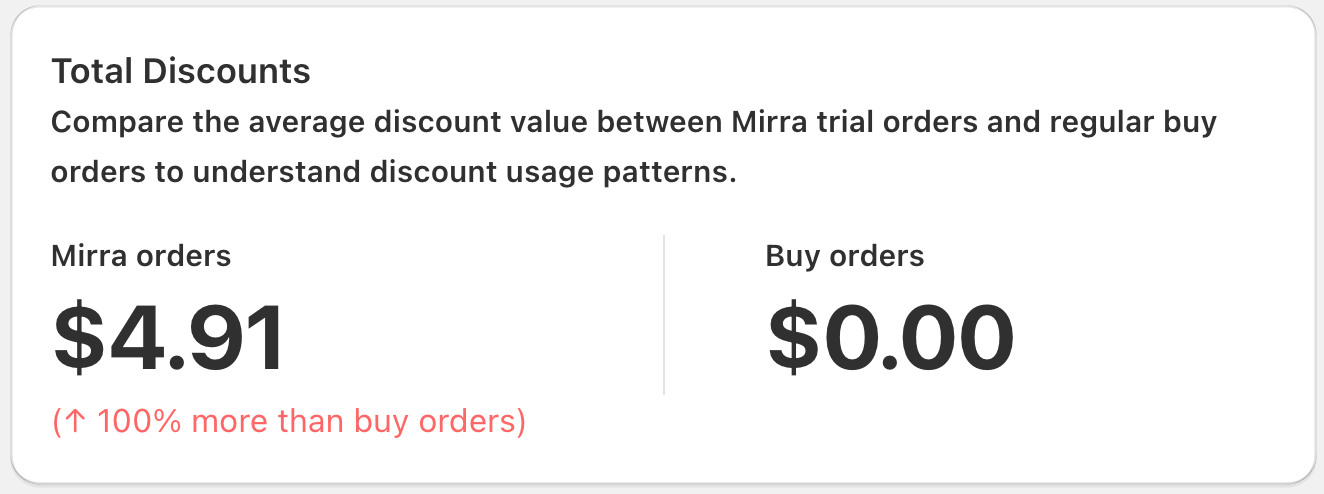
- Total Discounts: This widget shows the average discount value between Mirra orders and regular 'buy' orders within the selected time period.

- Note: If you have an increased AOV with Mirra orders, it's normal for the discounts on Mirra orders to be higher than for 'buy' orders.
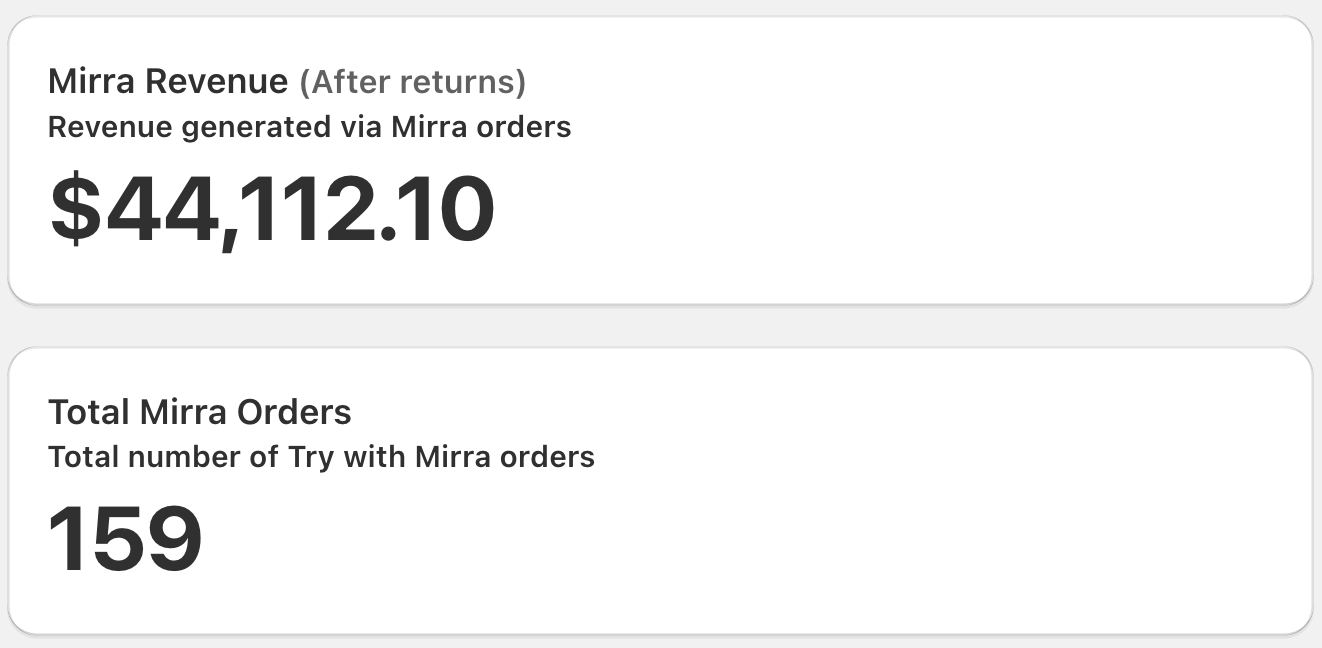
- Mirra Revenue & Total Mirra Orders: These widgets display the total revenue generated from Mirra orders (after returns) and the total number of Mirra orders placed within the selected time period.

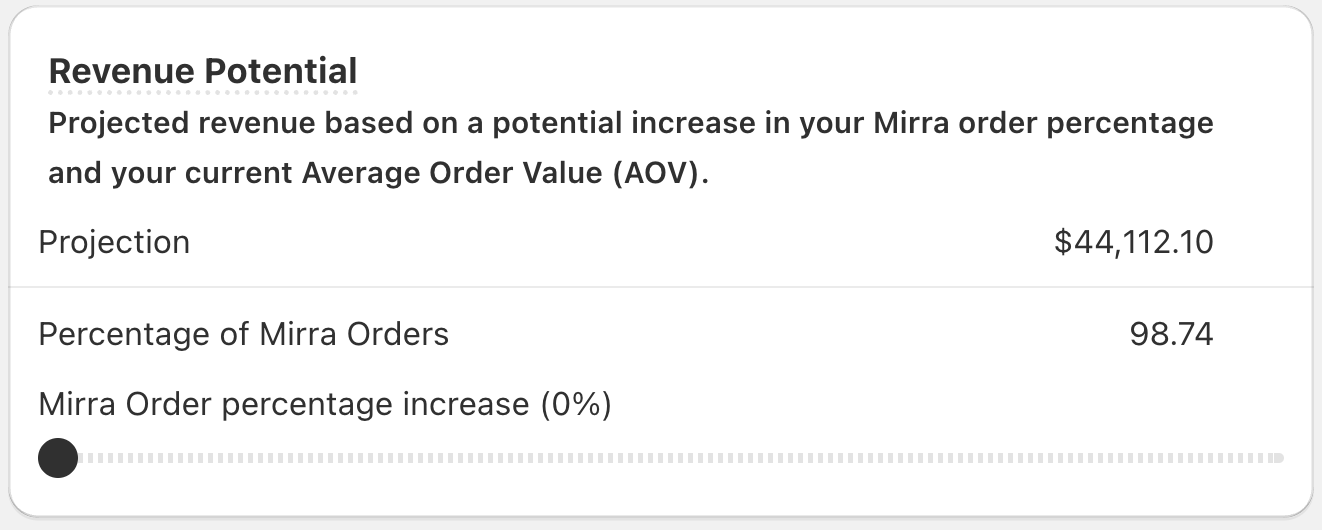
- Revenue Potential: This calculator widget shows potential revenue if your Mirra order % were to increase, based off your current Average Order Value for the selected time period. Slide the ball along the bar to see the difference!

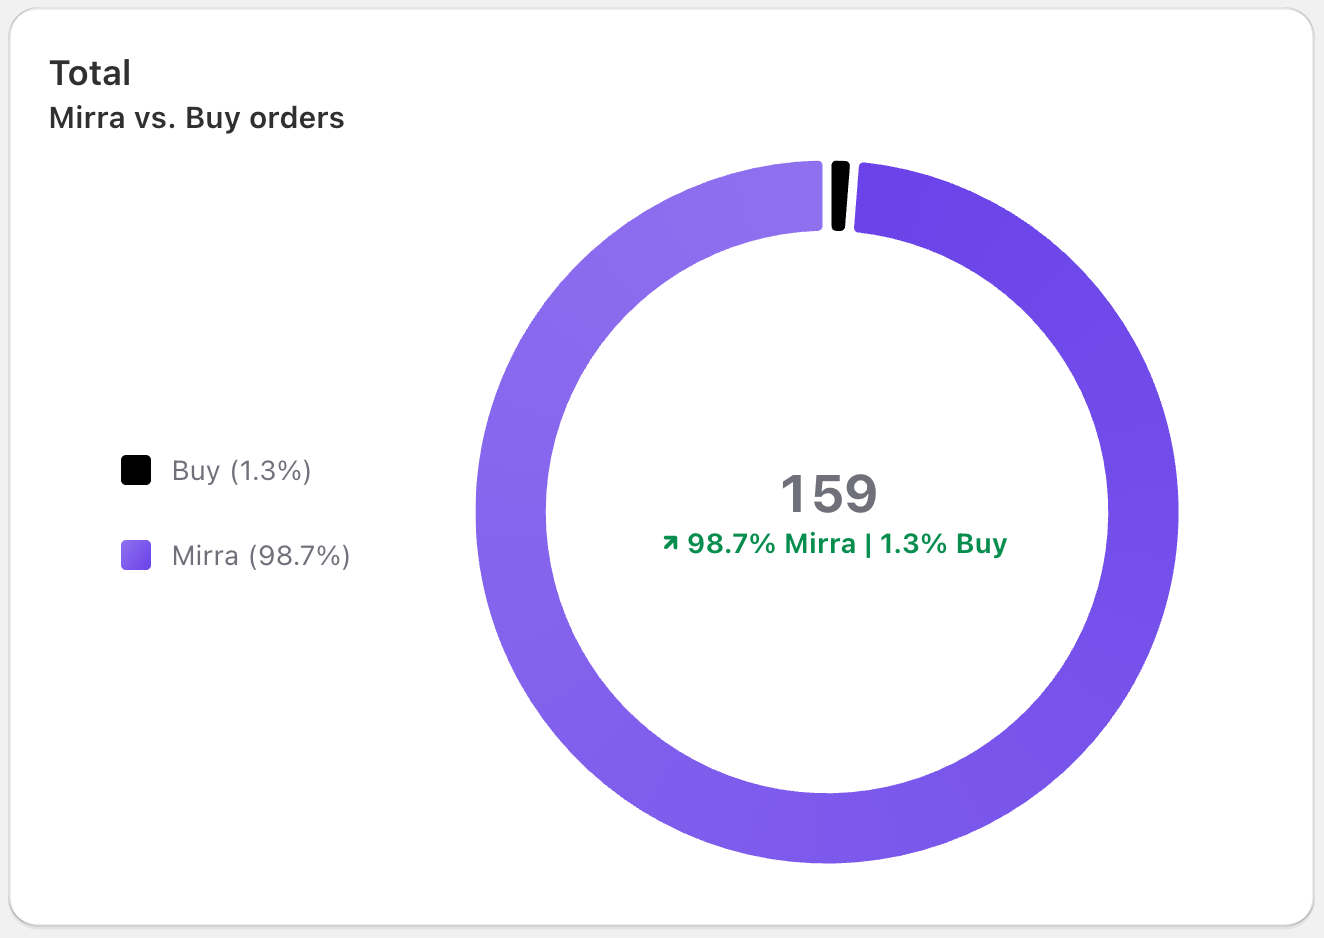
- Total (MIrra vs. Buy Orders): This widget shows the % of orders placed within the selected time period that were Mirra orders vs. 'buy' orders.

Returns Analytics
The lower section of the Analytics Dashboard displays data related to returns, which can be useful to understand which products are performing well, as well as why customers are returning items - this can inform if products are often running large/small, or if customers may need some extra support in styling their items.
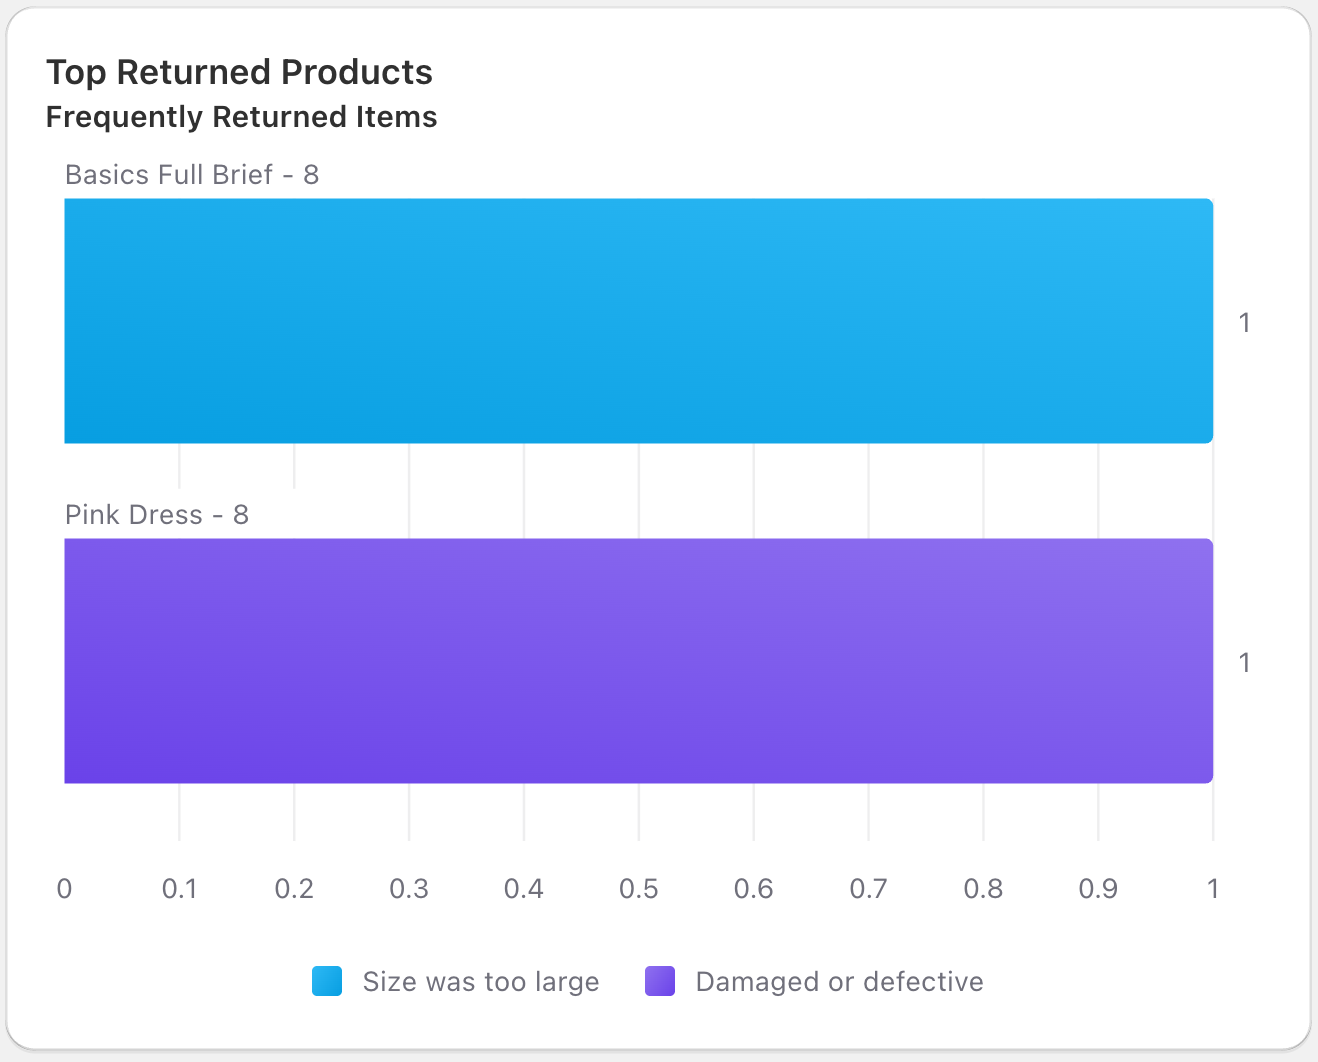
- Top Returned Products: This widget shows the items that have been most frequently returned in the selected time period, colour-coded by the reason they were returned.

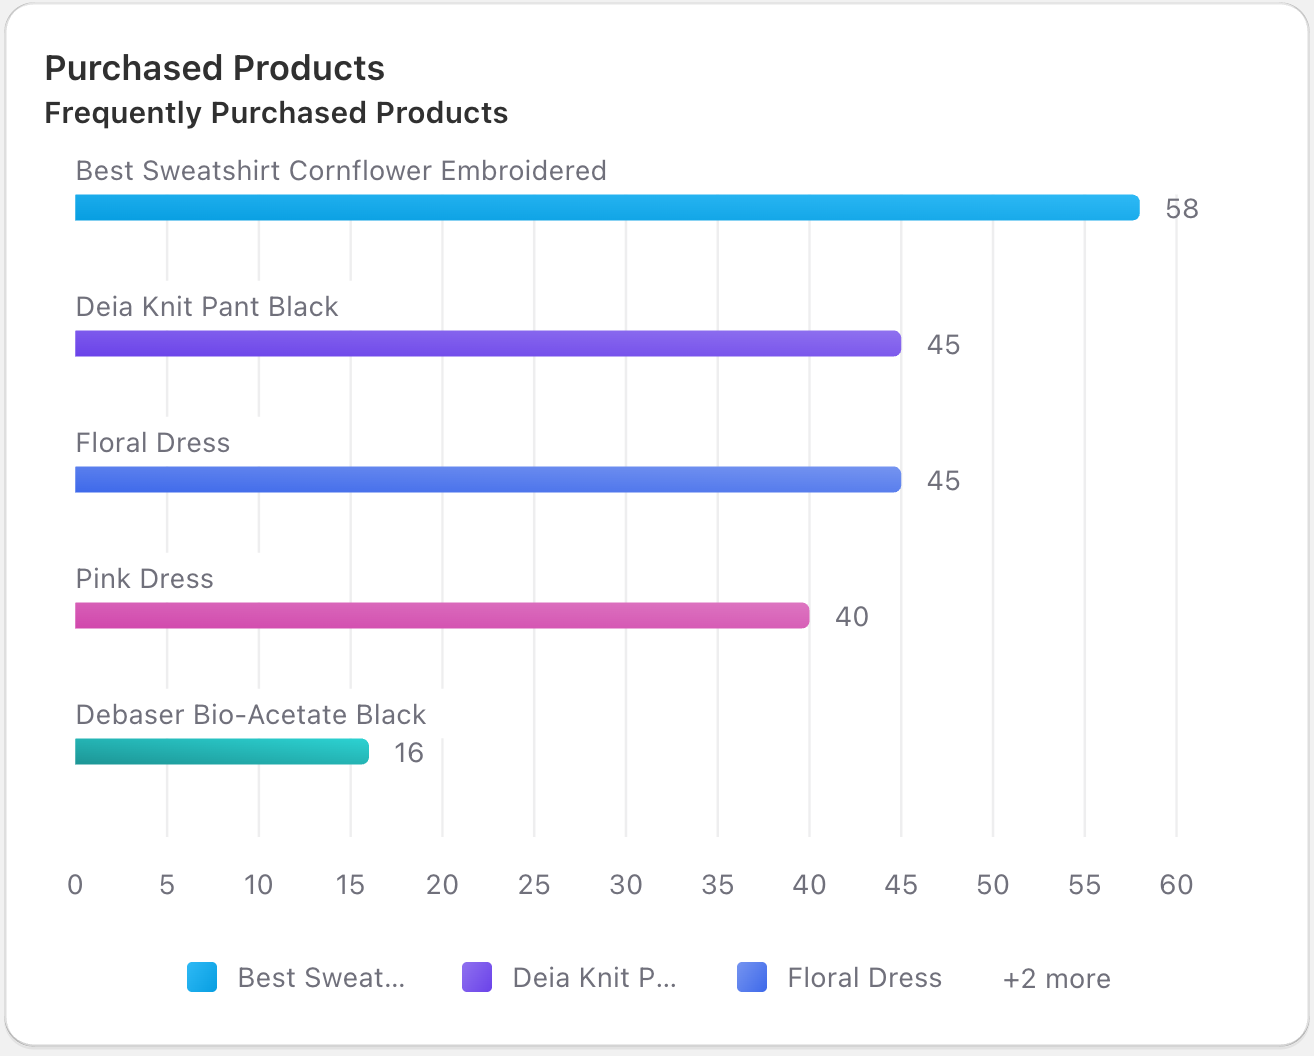
- Purchased Products: This widget shows the products customers have most frequently purchased using Mirra in the selected time period.

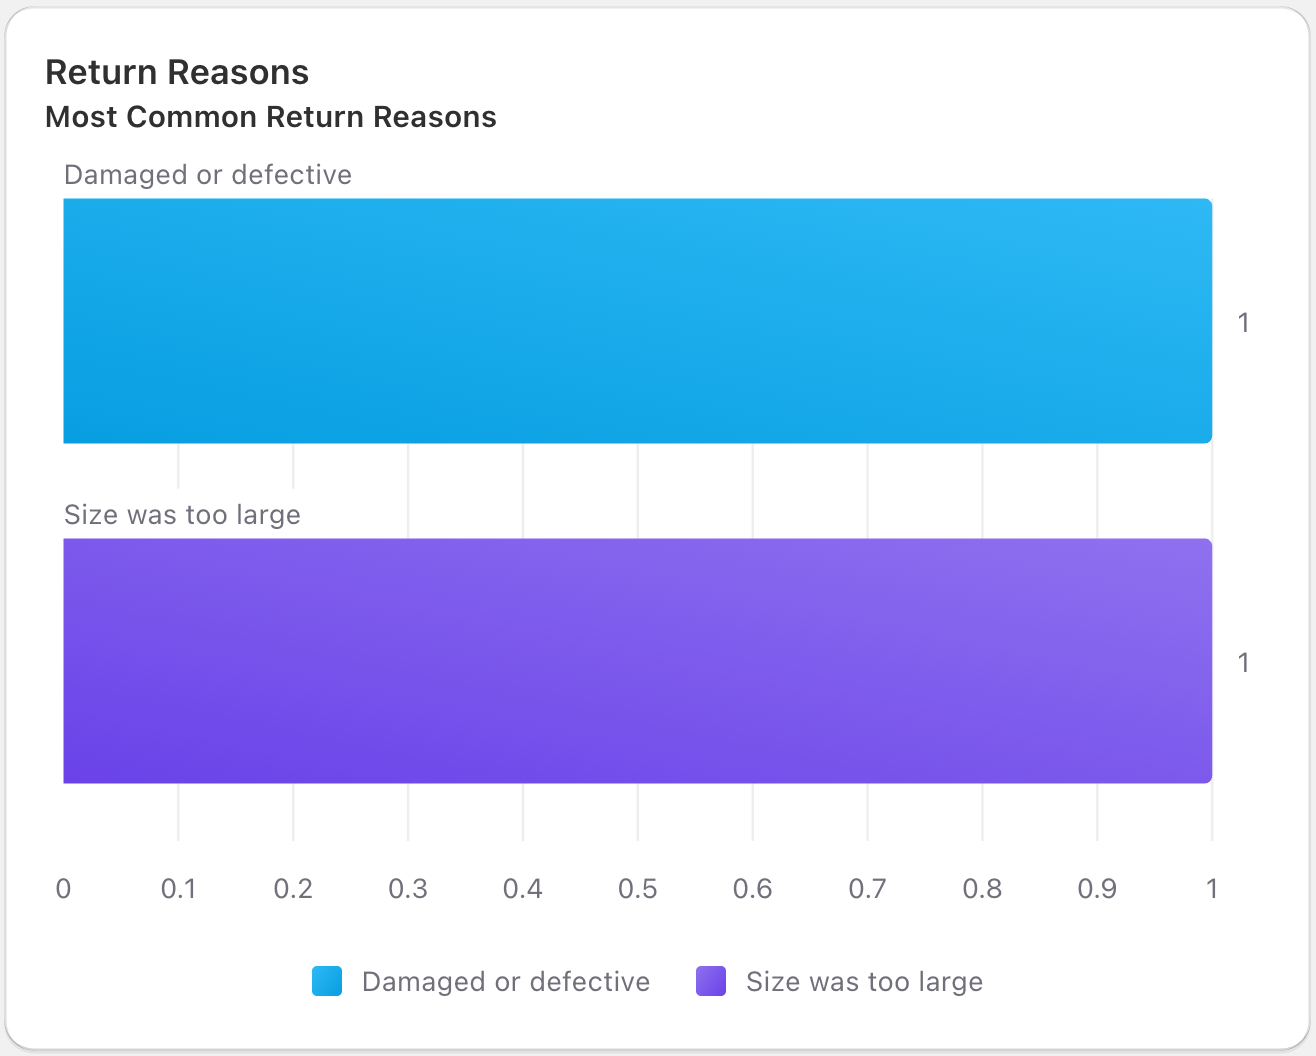
- Return Reasons: This widget shows the most common return reasons that customers have selected in the given time period. This can highlight trends in product sizing, or if customers are having difficulty with styling.

- Return Reasons can be customised in the settings screen. See our settings guide to learn more!
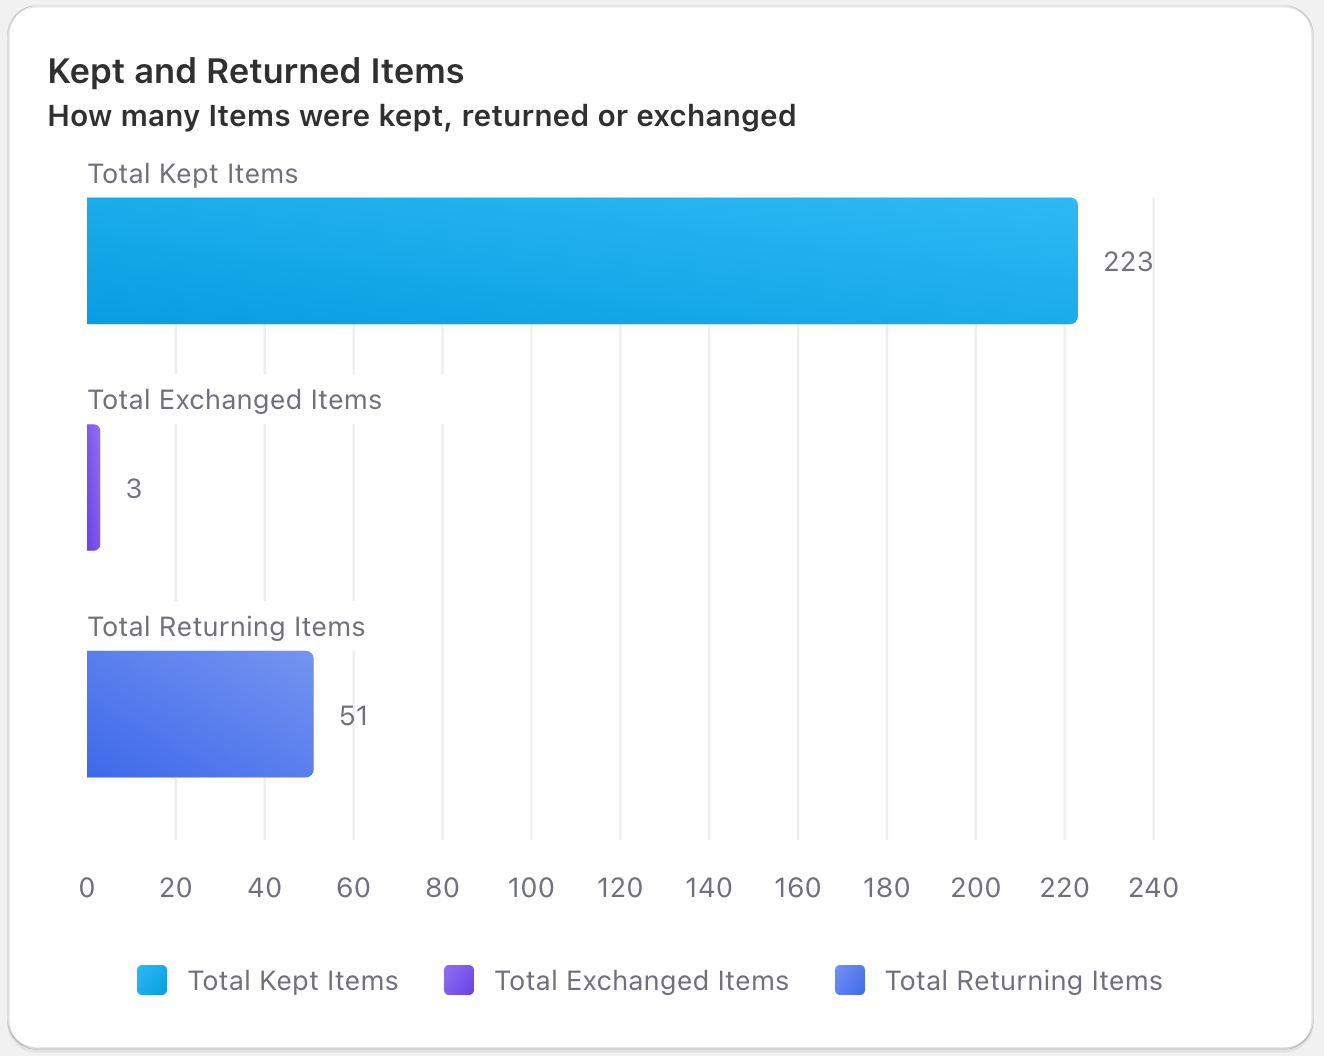
- Kept and Returned Items: This widget shows how many total items have been kept, exchanged and returned in the selected time period. This includes orders where customers have kept some items and returned some items.

- Item Revenue: This widget shows the revenue generated from Mirra items kept or exchanged in the selected time period, excluding discounts, tax, and return shipping fees.

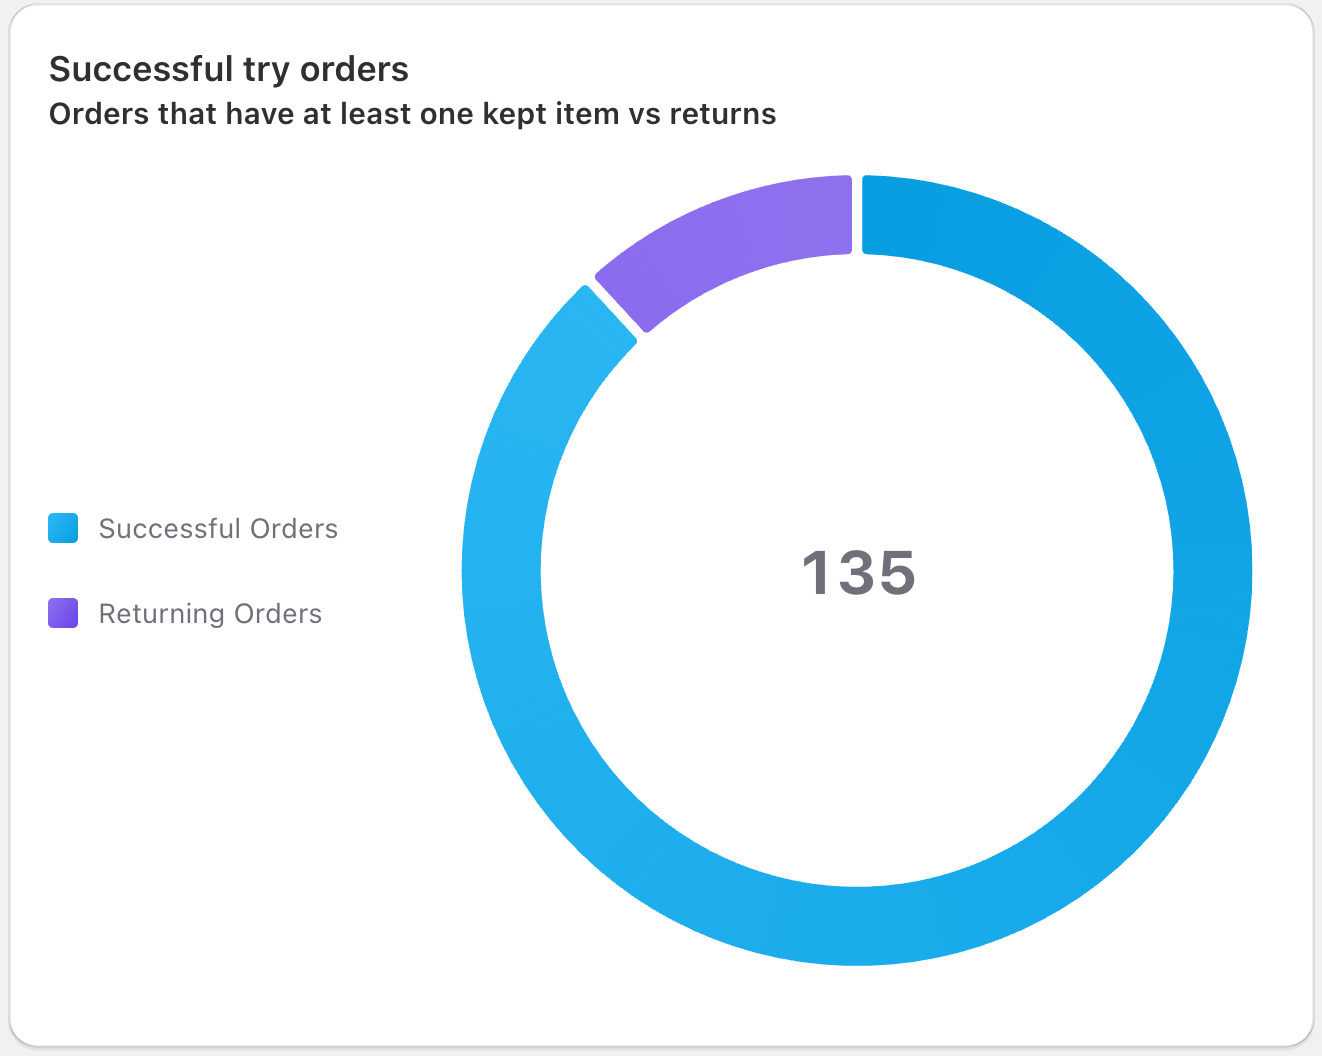
- Successful Try Orders: This widget shows the number of orders in the selected time period that had at least one item kept vs. orders where the customer returned all Mirra items.